Time (weeks) between isolation and availability of the data
Published: 22 January 2021
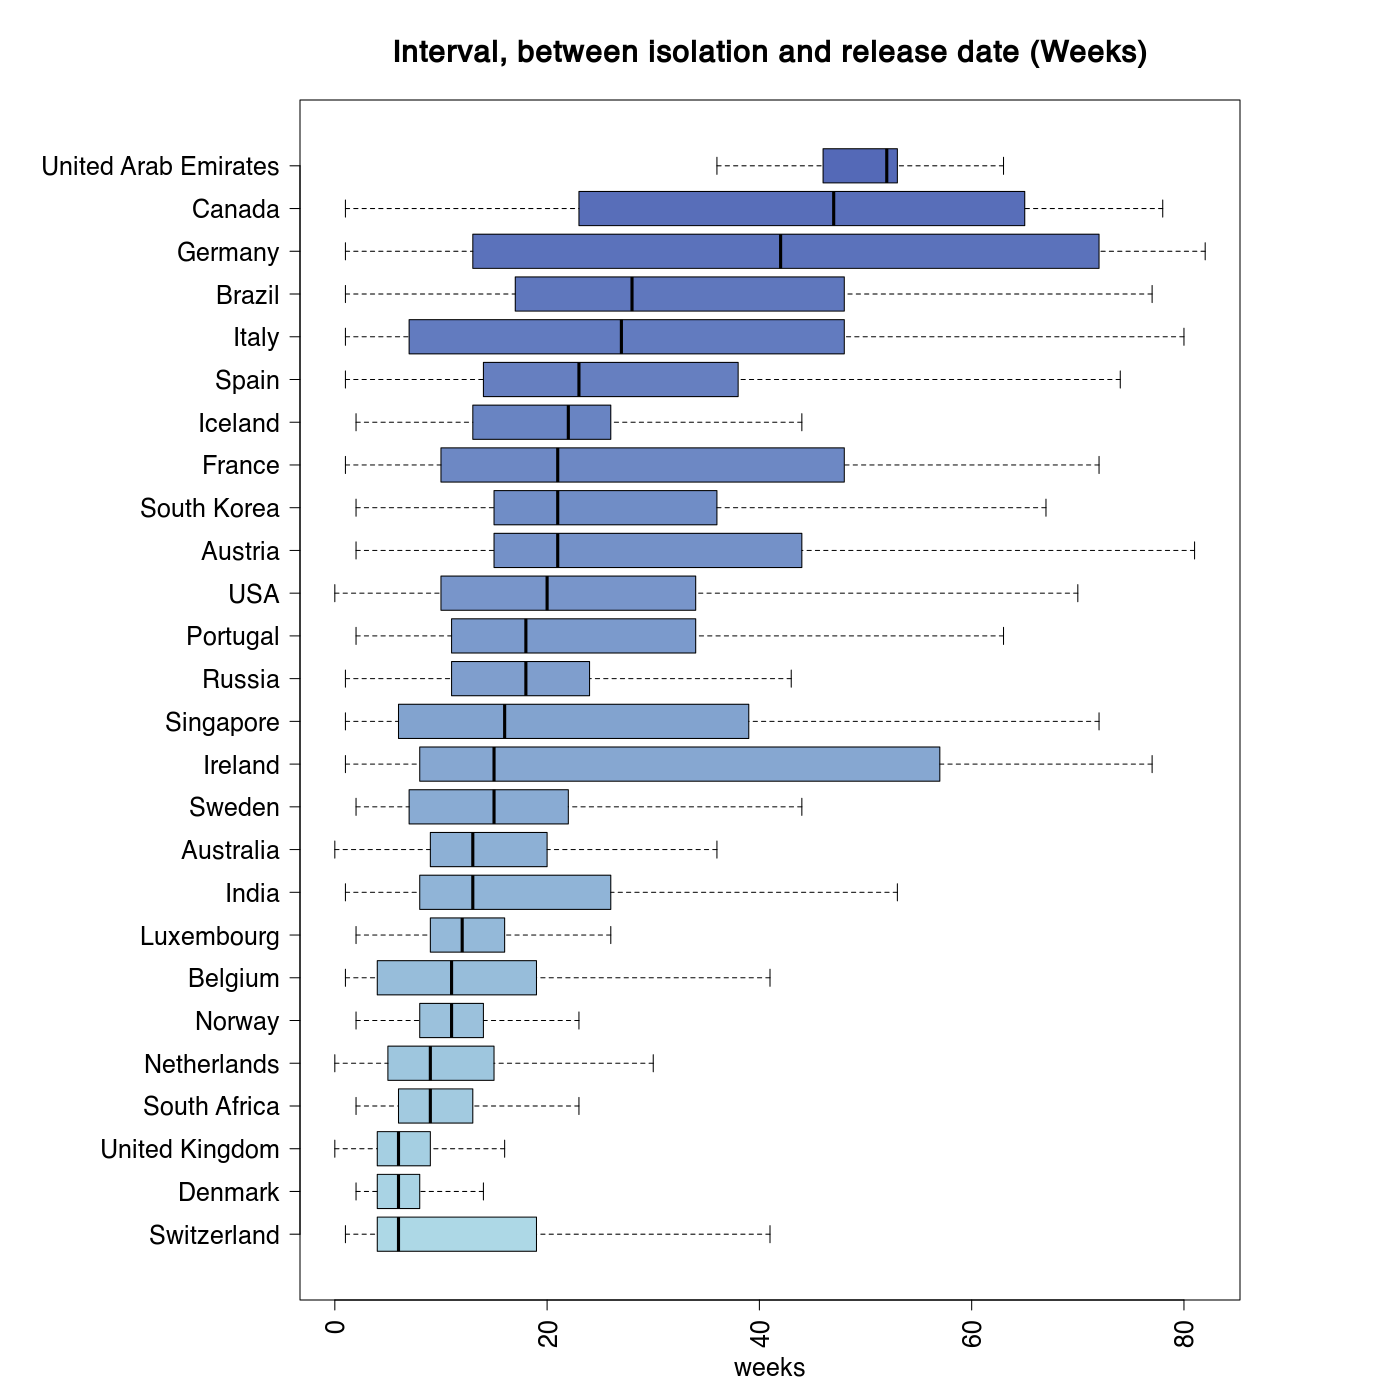
This graph provides an overview of the time required in different countries to complete the sequencing of a SARS-CoV-2 genome and make the sequence publicly available in a database. SARS-CoV-2 is the etiological agent (the pathogen that causes the disease) of COVID-19. Sequencing the genome of the pathogen allows the monitoring of its evolution and the identification of novel strains or new variants. This approach is known as “genomic surveillance”, and represents the first line of defense against the spread of more dangerous variants of the virus, and at the same time can provide useful indications for the development of novel vaccines or drugs. To be effective, a genomic surveillance system requires that the pathogen’s genome sequences should be made available as quickly as possible. This graph shows, for different countries, the time interval between the isolation of a SARS-CoV-2 sample and the deposition of the corresponding genomic sequence in a public database. The graph offers a measure of the “speed” of the different genomic surveillance systems. In this case, small values (ideally close to 0) are to be considered ideal, while prolonged time intervals can compromise the effectiveness of surveillance systems.
Source: https://www.gisaid.org/