Prevalence of SARS-CoV-2 variants in Italy (ISS report n. 9)
29 September 2021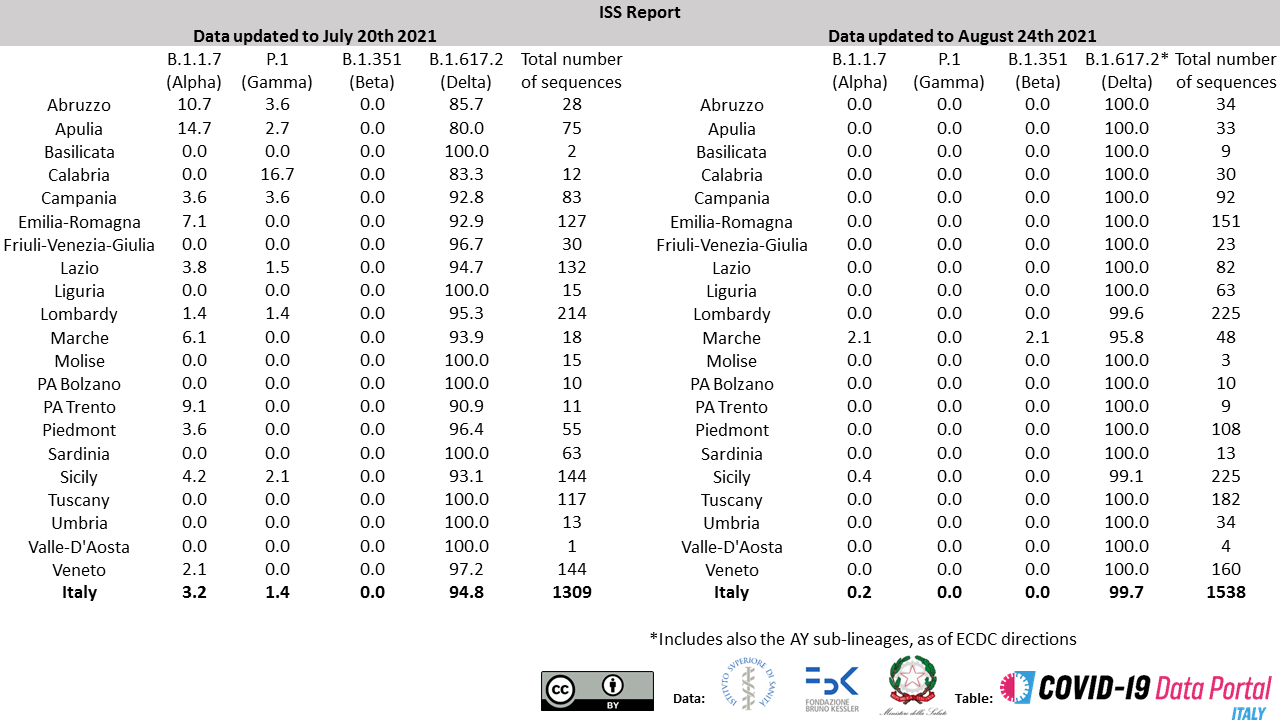
The I-Co-Gen platform developed by the Italian National Institute of Health (ISS), and released in April 2021, is currently the most up to date and reliable system for the analysis and collection of SARS-CoV-2 genomic sequences in Italy. Since the release of I-Co-Gen the Italian National Institute of Health (ISS), supported by the Bruno Kessler Foundation and in collaboration with the Italian Ministry of Health, the Regional administrations and the Autonomous Provinces (PPAA), have started an ongoing and coordinated effort for the accurate mapping of the spread of SARS-CoV-2 variants in Italy. Results are released periodically in the form of brief reports (further details here).
This highlight provides a brief overview of the main results presented in the most recent report (data updated to August 24th 2021). Data from the previous report (July 20th 2021) are also included to facilitate the comparison.
Read more This highlight provides a brief overview of the main results presented in the most recent report (data updated to August 24th 2021). Data from the previous report (July 20th 2021) are also included to facilitate the comparison.
International prevalence of SARS-CoV-2 lineages
03 September 2021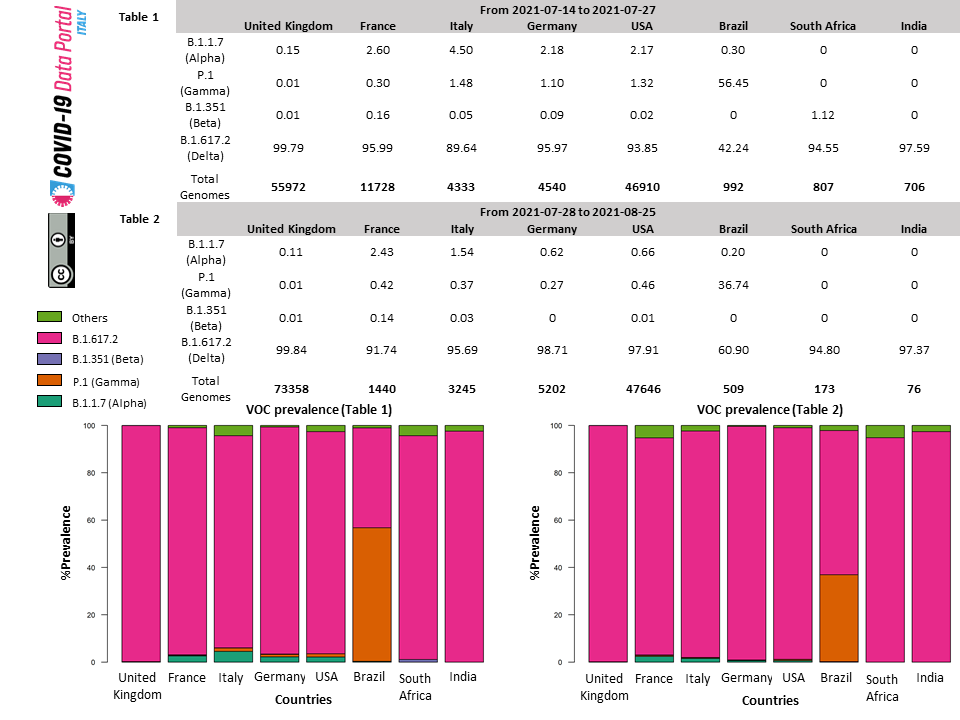
All viruses, including SARS-CoV-2, the virus that causes COVID-19, change over time. Most changes have little to no impact, however, some changes may affect the virus’s properties, such as how easily it spreads, the severity of the disease, or the efficacy of vaccines. International health authorities have identified 4 variants of SARS-CoV-2 (see here for further details) that, due to their enhanced infectivity and their ability to escape recognition by some antibodies, should be subjected to more careful monitoring. Collectively these variants are known under the acronym VOC (Variant of Concern). The tables included in this report offer an overview, as of August 25th, of the prevalence and geographic distribution of these variants in various European and extra-European countries.
Two non-overlapping time intervals are compared to illustrate the circulation of VOCs in space. Table 2 incorporates data from July 28th (last update) to August 25th 2021, while Table 1 reports equivalent data for the interval considered in the previous update (from July 14th to July 27th 2021). Finally, the bar plots provide a graphical representation of the data.
Read more Two non-overlapping time intervals are compared to illustrate the circulation of VOCs in space. Table 2 incorporates data from July 28th (last update) to August 25th 2021, while Table 1 reports equivalent data for the interval considered in the previous update (from July 14th to July 27th 2021). Finally, the bar plots provide a graphical representation of the data.
Italian prevalence of SARS-CoV-2 variants (ISS report n. 6)
03 September 2021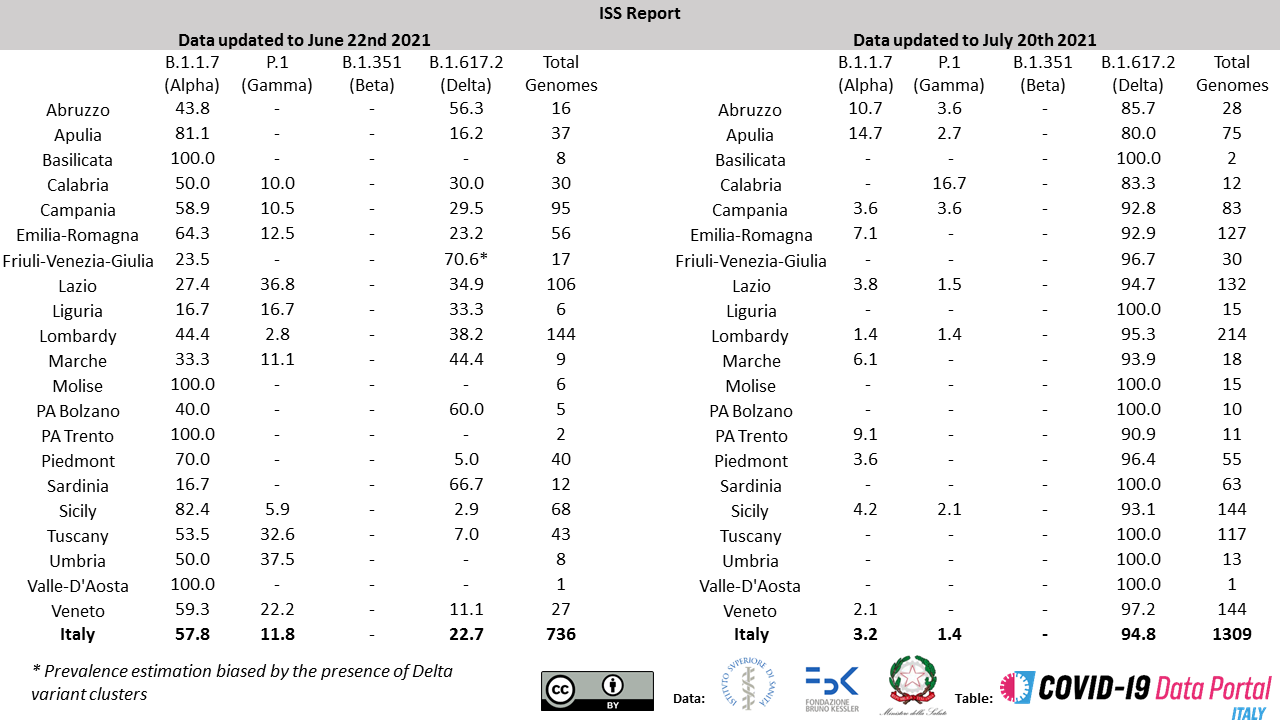
Released in April 2021, the I-Co-Gen platform developed by the Italian National Institute of Health (ISS) is currently the most up to date and reliable system for the analysis and collection of SARS-CoV-2 genomic sequences in Italy. Since the release of I-Co-Gen the Italian National Institute of Health (ISS), supported by the Bruno Kessler Foundation and in collaboration with the Italian Ministry of Health, the Regional administrations and the Autonomous Provinces (PPAA), have started an ongoing and coordinate effort for the accurate mapping of the spread of SARS-CoV-2 VOCs in Italy. Results are released periodically in the form of brief reports (further details here).
This highlight provides a brief overview of the main results presented in the most recent report (data updated to July 20th 2021). Data from the previous report (June 22nd 2021) are also included to facilitate the comparison.
Read more This highlight provides a brief overview of the main results presented in the most recent report (data updated to July 20th 2021). Data from the previous report (June 22nd 2021) are also included to facilitate the comparison.
International prevalence of SARS-CoV-2 lineages
04 August 2021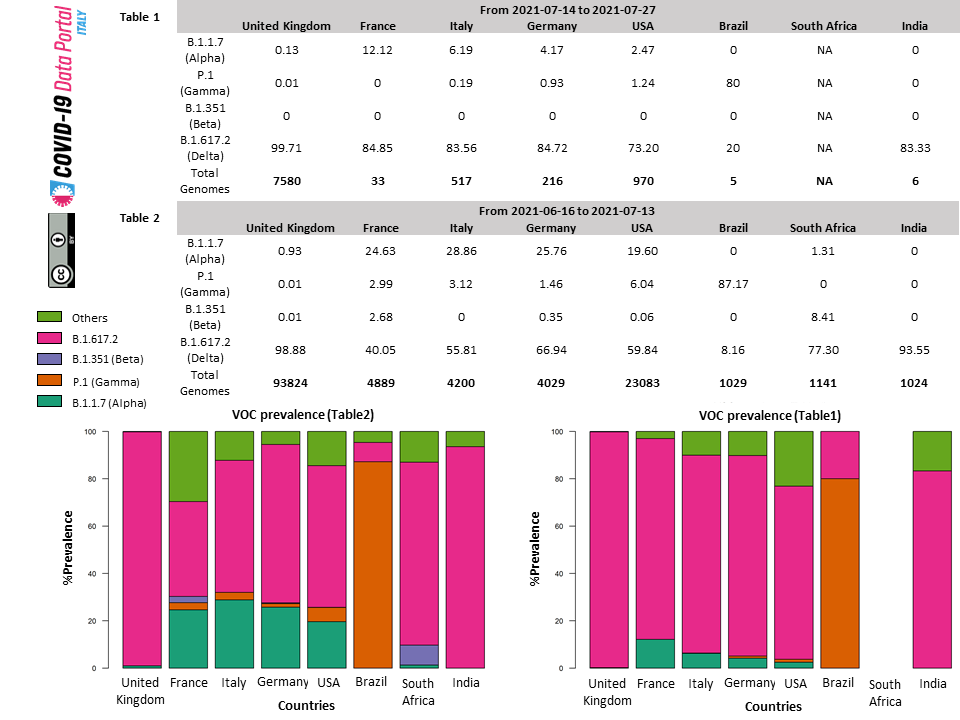
All viruses, including SARS-CoV-2, the virus that causes COVID-19, change over time. Most changes have little to no impact, however, some changes may affect the virus’s properties, such as how easily it spreads, the severity of the disease, or the efficacy of vaccines. International health authorities have identified 4 variants of SARS-CoV-2 (see here for further details) that, due to their enhanced infectivity and their ability to escape recognition by some antibodies, should be subjected to more careful monitoring. Collectively these variants are known under the acronym VOC (Variants of Concern). The tables included in this report offer an overview, as of July 27th, of the prevalence and geographic distribution of these variants in various European and extra-European countries.
Two non-overlapping time intervals are compared to illustrate the circulation of VOCs in space. Table 1 incorporates data from July 14th (last update) to July 27th 2021, while Table 2 reports equivalent data for the interval considered in the previous update (from June 16th to July 13th 2021). Finally, the bar plots provide a graphical representation of the data.
Read more Two non-overlapping time intervals are compared to illustrate the circulation of VOCs in space. Table 1 incorporates data from July 14th (last update) to July 27th 2021, while Table 2 reports equivalent data for the interval considered in the previous update (from June 16th to July 13th 2021). Finally, the bar plots provide a graphical representation of the data.
ISS report n. 4 about variants
17 July 2021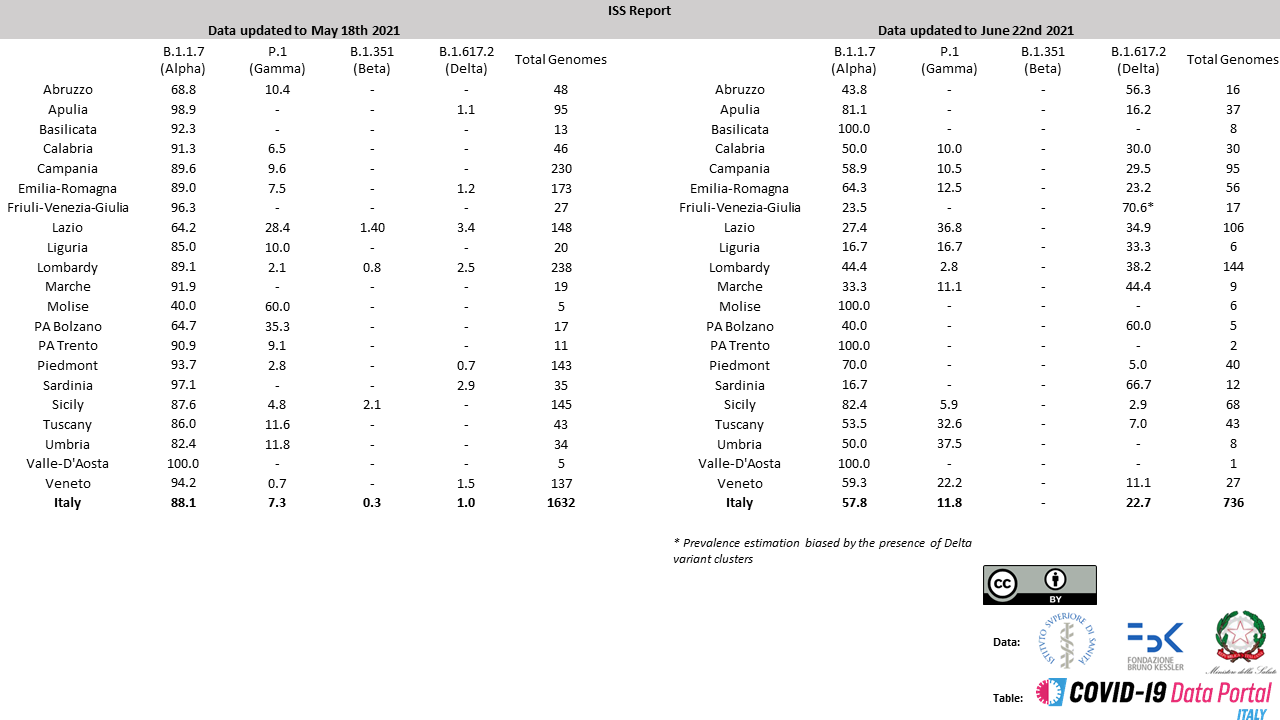
Released in April 2021, the I-Co-Gen platform developed by the Italian National Institute of Health (ISS) is currently the most up to date and reliable system for the analysis and collection of SARS-CoV-2 genomic sequences in our country. Since the release of I-Co-Gen the Italian National Institute of Health (ISS), supported by the Bruno Kessler Foundation and in collaboration with the Italian Ministry of Health, the Regional administrations and the Autonomous Provinces (PPAA), have started an ongoing and coordinate effort for the accurate mapping of the spread of SARS-CoV-2 VOCs in Italy. Results are released periodically in the form of brief reports (further details here).
This highlight provides a brief overview of the main results presented in the most recent report (data updated to June 22nd 2021). Data from the previous report (May 18th 2021) are also included to facilitate the comparison.
Read more This highlight provides a brief overview of the main results presented in the most recent report (data updated to June 22nd 2021). Data from the previous report (May 18th 2021) are also included to facilitate the comparison.
Prevalence of SARS-CoV-2 lineages
17 July 2021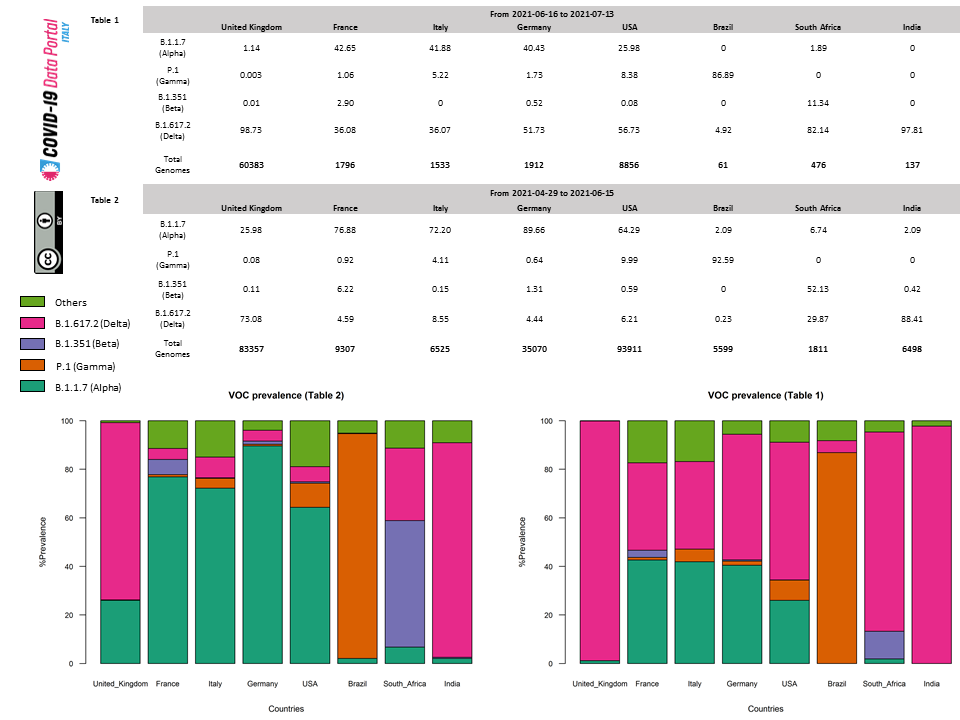
All viruses, including SARS-CoV-2, the virus that causes COVID-19, change over time. Most changes have little to no impact, however, some changes may affect the virus’s properties, such as how easily it spreads, the severity of the disease, or the performance of vaccines. International health authorities have identified 4 variants of SARS-CoV-2 (see here for further details) that, due to their enhanced infectivity and their ability to escape recognition by some antibodies, should be subjected to more careful monitoring. Collectively these variants are known under the acronym VOC (Variants of Concern). The tables included in this report offer an overview, as of July 13th, of the prevalence and geographic distribution of these variants in various European and extra-European countries.
Two non-overlapping time intervals are compared to illustrate the circulation of VOCs in space. Table 1 incorporates data from June 16th (last update) to July 13th 2021, while Table 2 reports equivalent data for the interval considered in the previous update (from April 29th to June 15th 2021). Finally, the bar plots provide a graphical representation of the data.
Read more Two non-overlapping time intervals are compared to illustrate the circulation of VOCs in space. Table 1 incorporates data from June 16th (last update) to July 13th 2021, while Table 2 reports equivalent data for the interval considered in the previous update (from April 29th to June 15th 2021). Finally, the bar plots provide a graphical representation of the data.